Sand Hill Crane Occurrences 2023: Migration and Anomalies
The Sandhill Crane Migration
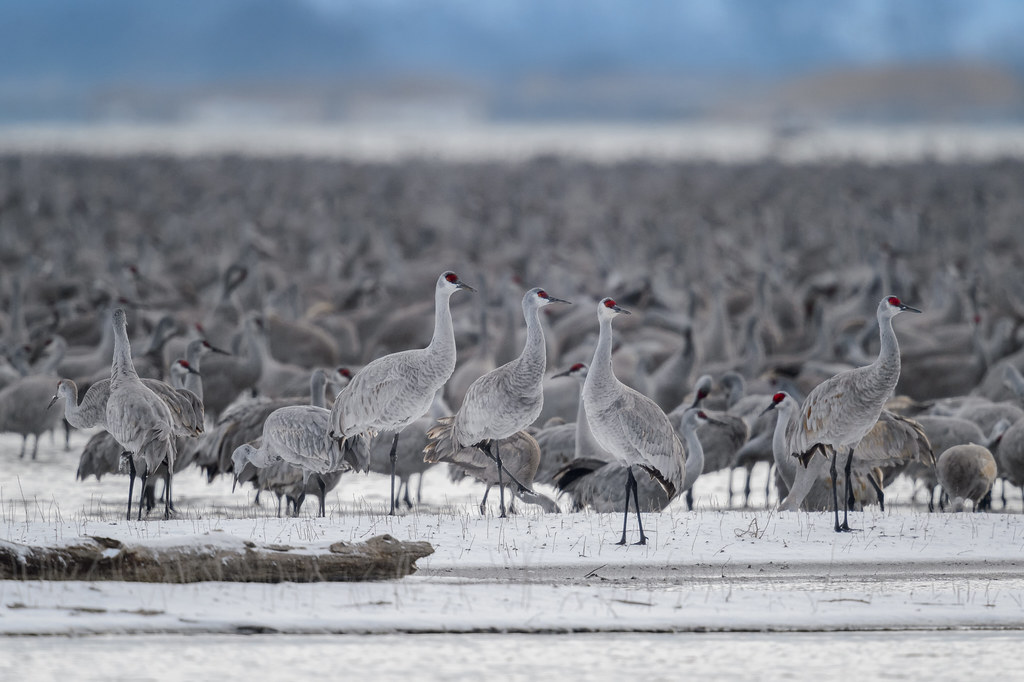
The Sandhill Crane Migrates long distance every spring and fall across North America and the extreme eastern part of Asia. The typically move north to across far Northern Canada, Alaska, and Siberia to breed. Their winter ranges are typically in the southern part of the US and in north-central Mexico. During their migrations, they gather at key stopover sites, like the Platte River in Nebraska, where over a quarter million birds gather at one time. Recent trends have shown the birds migrating later in the fall and earlier in the spring, and some populations not going as far south in winter as in the past.
There are some exceptions to this general migration. Sandhill cranes in Mississippi, Florida, and Cuba do not migrate: they nest in the same place they inhabit year round. Additionally, there are reports of vagrancy, or appear well outside their normal range, of sandhill cranes in Europe, China, Taiwan, and Japan. A vagrant population of sandhill cranes has also been attributed to sitting of Mothman in West Virginia in Winter 1966-67.

To visualize the most recent migration cycle, data from the 2023 sandhill crane migration was plotted.
Data Description
Data for sandhill crane occurrences in 2023 was downloaded from the Global Biodiversity Information Facility, or GBIF. GBIF is an international network aimed at providing open source data for all types of life on earth. It comprised of official scientific datasets and data that is crowd sourced by citizen-scientist. More information can be found here https://www.gbif.org/what-is-gbif
Geographical data for species distribution was download from work done by Dinerstein et al. from their paper “An Ecoregion-Based Approach to Protecting Half the Terrestrial Realm.” This work reassessed each unique terrestrial ecoregion of the world, and determined which remaining habitat was left in each. For this plot, the shapefiles of each reassessed ecoregion were used.
Method
To generate this plot,the data was downloaded from the above sources. Data was converted into geo-data frames, and merged together with a spatial join, only showing the ecoregion with occurrences, grouped by month. The data was then normalized by region and by month. The normalization was important to see the overall patterns of the migration, and to not put outsize emphasis on regions or months where there was overly many or overly few occurrences
Sandhill Crane Migration, 2023
In 2023 Migrating Sandhill Cranes continued their usual North American Migration, with a good amount of sittings in Asia and one in Europe
The plot shows a typical trend as expected from a sandhill crane migration. An exception to this is there appears to be a population in Asia, albeit small, that is mirroring the north to south migration in North America. There also appears to have been a vagrant population in Eastern Europe in April.
Further investigation topics could include what is happening with the population in East Asia and if there had been any recent vagrant populations in Eastern Europe before last year.
Sources
Code
# Dependancies
import time
import zipfile
import os
import pathlib
import pandas as pd
from getpass import getpass
from glob import glob
import geopandas as gpd
import pygbif.occurrences as occ
import pygbif.species as species
# Get month names
import calendar
import warnings
# Libraries for Dynamic mapping
import cartopy.crs as ccrs
import panel as pn
import hvplot
import hvplot.pandas
import geoviews as gv
#for getting rid of warnings for portfolio post (don't need to do untill at the end or if warning affecting plots)
#warnings.filterwarnings('ignore', category=FutureWarning)
c:\Users\Nolan Welsh\miniconda3\envs\earth-analytics-python\Lib\site-packages\dask\dataframe\__init__.py:42: FutureWarning: Dask dataframe query planning is disabled because dask-expr is not installed. You can install it with `pip install dask[dataframe]` or `conda install dask`. This will raise in a future version. warnings.warn(msg, FutureWarning)
Get Ecoregions
# Create data directory in the home folder
species_data_dir = os.path.join(
# Home directory
pathlib.Path.home(),
# Earth analytics data directory
'earth-analytics',
'data',
# Project directory
'migration-project-directory-Nolan-Welsh',
)
os.makedirs(species_data_dir, exist_ok=True)
species_data_dir
'C:\\Users\\Nolan Welsh\\earth-analytics\\data\\migration-project-directory-Nolan-Welsh'
# Set up the ecoregion boundary URL
region_url = "https://storage.googleapis.com/teow2016/Ecoregions2017.zip"
# Set up a path to save the data on your machine
region_dir = os.path.join(species_data_dir, 'resolve_ecoregions')
# Make the ecoregions directory
os.makedirs(region_dir, exist_ok=True)
# Join ecoregions shapefile path
region_path = os.path.join(region_dir, 'resolve_ecoregions.shp')
# Only download once
if not os.path.exists(region_path):
my_gdf = gpd.read_file(region_url)
my_gdf.to_file(region_path)
# Open up the ecoregions boundaries
gdf_ecoregions = gpd.read_file(region_path)
# Name the index so it will match the other data later on
gdf_ecoregions.index.name = 'ecoregion'
# Plot the ecoregions to check download
gdf_ecoregions.plot()
<Axes: >

Download Species Data from GBIF
# Create data directory in the home folder
data_dir = os.path.join(
# Home directory
pathlib.Path.home(),
# Earth analytics data directory
'earth-analytics',
'data',
# Project directory
'sandhill-crane-migration',
)
os.makedirs(data_dir, exist_ok=True)
# Define the directory name for GBIF data
gbif_dir = os.path.join(data_dir, 'sandhill-crane-migration')
reset_credentials = False
# GBIF needs a username, password, and email
credentials = dict(
GBIF_USER=(input, 'GBIF username:'),
GBIF_PWD=(getpass, 'GBIF password'),
GBIF_EMAIL=(input, 'GBIF email'),
)
for env_variable, (prompt_func, prompt_text) in credentials.items():
# Delete credential from environment if requested
if reset_credentials and (env_variable in os.environ):
os.environ.pop(env_variable)
# Ask for credential and save to environment
if not env_variable in os.environ:
os.environ[env_variable] = prompt_func(prompt_text)
# Query species
species_info = species.name_lookup('Sandhill Crane', rank='SPECIES')
# Get the first result
first_result = species_info['results'][0]
# Get the species key (nubKey)
species_key = first_result['nubKey']
# Check the result
first_result['species'], species_key
('Antigone canadensis', 9036008)
# Only download once
gbif_pattern = os.path.join(gbif_dir, '*.csv')
if not glob(gbif_pattern):
# Only submit one request
if not 'GBIF_DOWNLOAD_KEY' in os.environ:
# Submit query to GBIF, used taxonKey instead of species key here,
# this worked for me base on what I saw on the GBIF website search
gbif_query = occ.download([
f"taxonKey = {species_key}",
"year = 2023",
"hasCoordinate = TRUE"
])
download_key=gbif_query[0]
os.environ['GBIF_DOWNLOAD_KEY'] = gbif_query[0]
else:
download_key = os.environ['GBIF_DOWNLOAD_KEY']
# Wait for the download to build
wait = occ.download_meta(download_key)['status']
while not wait=='SUCCEEDED':
wait = occ.download_meta(download_key)['status']
time.sleep(5)
# Download GBIF data
download_info = occ.download_get(
os.environ['GBIF_DOWNLOAD_KEY'],
path=data_dir)
# Unzip GBIF data
with zipfile.ZipFile(download_info['path']) as download_zip:
download_zip.extractall(path=gbif_dir)
# Find the extracted .csv file path (take the first result)
gbif_path = glob(gbif_pattern)[0]
# Load the GBIF data
gbif_sandcrane_df = pd.read_csv(
gbif_path,
delimiter='\t',
index_col='gbifID',
usecols=['gbifID', 'decimalLatitude','decimalLongitude', 'month', 'countryCode']
)
gbif_sandcrane_df
| countryCode | decimalLatitude | decimalLongitude | month | |
|---|---|---|---|---|
| gbifID | ||||
| 4704199879 | US | 26.649673 | -81.686935 | 2 |
| 4826111054 | US | 41.437645 | -80.791180 | 5 |
| 4668276308 | US | 46.991810 | -95.980255 | 5 |
| 4670343687 | CA | 43.908220 | -77.278465 | 6 |
| 4716598123 | US | 43.127975 | -88.959660 | 4 |
| ... | ... | ... | ... | ... |
| 4678731776 | US | 42.245117 | -85.156530 | 3 |
| 4816316846 | US | 35.408360 | -85.006030 | 12 |
| 4685501560 | US | 46.976685 | -123.542404 | 1 |
| 4645021459 | US | 44.317410 | -89.583770 | 5 |
| 4721553964 | US | 43.112324 | -78.404850 | 10 |
310591 rows × 4 columns
# Filter Sandcrane occurances by country
#NA_Countries= ['US', 'CA', 'MX', 'CU', 'RU']
#gbif_filter_df =gbif_sandcrane_df[
#gbif_sandcrane_df['countryCode'].isin(NA_Countries)
# .drop(columns='countryCode')
# ]
#filter out above because there is some cranes that do migrate within asia.
gbif_filter_df=gbif_sandcrane_df
gbif_gdf = (
gpd.GeoDataFrame(
gbif_filter_df,
geometry=gpd.points_from_xy(
gbif_filter_df.decimalLongitude,
gbif_filter_df.decimalLatitude),
crs="EPSG:4326") #indicated we are using lat and long, in decimal degrees
# Select the desired columns
[['month', 'geometry']]
)
gbif_gdf
| month | geometry | |
|---|---|---|
| gbifID | ||
| 4704199879 | 2 | POINT (-81.68694 26.64967) |
| 4826111054 | 5 | POINT (-80.79118 41.43764) |
| 4668276308 | 5 | POINT (-95.98026 46.99181) |
| 4670343687 | 6 | POINT (-77.27846 43.90822) |
| 4716598123 | 4 | POINT (-88.95966 43.12798) |
| ... | ... | ... |
| 4678731776 | 3 | POINT (-85.15653 42.24512) |
| 4816316846 | 12 | POINT (-85.00603 35.40836) |
| 4685501560 | 1 | POINT (-123.5424 46.97668) |
| 4645021459 | 5 | POINT (-89.58377 44.31741) |
| 4721553964 | 10 | POINT (-78.40485 43.11232) |
310591 rows × 2 columns
Normalize Data
#Use a spatial Join to find all the gbif occurences containing ecoregions
gbif_ecoregion_gdf = (
gdf_ecoregions
# Match the CRS of the GBIF data and the ecoregions
.to_crs(gbif_gdf.crs)
# Find ecoregion for each observation
.sjoin(
gbif_gdf,
how='inner',
predicate='contains')
# Select the required columns
[['month', 'gbifID', 'SHAPE_AREA']]
.reset_index()
.rename(columns={
'index':'ecoregion',
'gbifID' : 'observation_id' #needed to reset index to get unquie IDs for every row
})
)
gbif_ecoregion_gdf
| ecoregion | month | observation_id | SHAPE_AREA | |
|---|---|---|---|---|
| 0 | 4 | 5 | 4644511800 | 8.196573 |
| 1 | 4 | 7 | 4792706312 | 8.196573 |
| 2 | 4 | 7 | 4795806198 | 8.196573 |
| 3 | 4 | 7 | 4700107974 | 8.196573 |
| 4 | 4 | 7 | 4620196883 | 8.196573 |
| ... | ... | ... | ... | ... |
| 301264 | 833 | 6 | 4729374620 | 35.905513 |
| 301265 | 833 | 5 | 4644361401 | 35.905513 |
| 301266 | 833 | 5 | 4762871013 | 35.905513 |
| 301267 | 833 | 5 | 4843448578 | 35.905513 |
| 301268 | 833 | 5 | 4763013510 | 35.905513 |
301269 rows × 4 columns
#count and group mean occurence by ecoregions and by month
occurrence_df = (
gbif_ecoregion_gdf
#reset indes
.reset_index()
# For each ecoregion, for each month...
.groupby(['ecoregion', 'month'])
# ...count the number of occurrences
#.agg counts all of GBIF Ids in the group
.agg(
occurrences=('observation_id', 'count'),
area=('SHAPE_AREA', 'first'))
)
#normalize by area
occurrence_df['density'] = (
occurrence_df.occurrences
/ occurrence_df.area
)
# Get rid of rare observations (possible misidentification?)
occurrence_df = occurrence_df[occurrence_df.occurrences>1]
# Take the mean by ecoregion
mean_occurrences_by_ecoregion = (
occurrence_df
.groupby(['ecoregion'])
.mean()
)
# Take the mean by month
mean_occurrences_by_month = (
occurrence_df
.groupby(['month'])
.mean()
)
# Normalize by space and time for sampling effort
occurrence_df['norm_occurrences'] = (
occurrence_df['density']
/mean_occurrences_by_ecoregion['density']
/mean_occurrences_by_month['density']
)
occurrence_df
| occurrences | area | density | norm_occurrences | ||
|---|---|---|---|---|---|
| ecoregion | month | ||||
| 4 | 5 | 2 | 8.196573 | 0.244004 | 0.016800 |
| 7 | 5 | 8.196573 | 0.610011 | 0.121033 | |
| 9 | 5 | 3 | 28.388010 | 0.105678 | 0.013569 |
| 6 | 2 | 28.388010 | 0.070452 | 0.018831 | |
| 8 | 8 | 28.388010 | 0.281809 | 0.088700 | |
| ... | ... | ... | ... | ... | ... |
| 833 | 7 | 167 | 35.905513 | 4.651096 | 0.086040 |
| 8 | 176 | 35.905513 | 4.901754 | 0.077133 | |
| 9 | 131 | 35.905513 | 3.648465 | 0.044360 | |
| 10 | 94 | 35.905513 | 2.617982 | 0.028650 | |
| 11 | 25 | 35.905513 | 0.696272 | 0.006173 |
773 rows × 4 columns
# plot to check distrubions
occurrence_df.reset_index().plot.scatter(
x='month', y='norm_occurrences', c='ecoregion',
logy=True
)
<Axes: xlabel='month', ylabel='norm_occurrences'>

Plot
# Change the CRS to Mercator for mapping
gdf_ecoregions = gdf_ecoregions.to_crs(ccrs.Mercator())
# Simplify the geometry to speed up processing
gdf_ecoregions.geometry = gdf_ecoregions.simplify(
.05, preserve_topology=False)
# Check that the plot runs in a reasonable amount of time
gdf_ecoregions.hvplot(geo=True, crs=(ccrs.Mercator()))
occurrence_df
| occurrences | area | density | norm_occurrences | ||
|---|---|---|---|---|---|
| ecoregion | month | ||||
| 4 | 5 | 2 | 8.196573 | 0.244004 | 0.016800 |
| 7 | 5 | 8.196573 | 0.610011 | 0.121033 | |
| 9 | 5 | 3 | 28.388010 | 0.105678 | 0.013569 |
| 6 | 2 | 28.388010 | 0.070452 | 0.018831 | |
| 8 | 8 | 28.388010 | 0.281809 | 0.088700 | |
| ... | ... | ... | ... | ... | ... |
| 833 | 7 | 167 | 35.905513 | 4.651096 | 0.086040 |
| 8 | 176 | 35.905513 | 4.901754 | 0.077133 | |
| 9 | 131 | 35.905513 | 3.648465 | 0.044360 | |
| 10 | 94 | 35.905513 | 2.617982 | 0.028650 | |
| 11 | 25 | 35.905513 | 0.696272 | 0.006173 |
773 rows × 4 columns
gdf_ecoregions
| OBJECTID | ECO_NAME | BIOME_NUM | BIOME_NAME | REALM | ECO_BIOME_ | NNH | ECO_ID | SHAPE_LENG | SHAPE_AREA | NNH_NAME | COLOR | COLOR_BIO | COLOR_NNH | LICENSE | geometry | |
|---|---|---|---|---|---|---|---|---|---|---|---|---|---|---|---|---|
| ecoregion | ||||||||||||||||
| 0 | 1.0 | Adelie Land tundra | 11.0 | Tundra | Antarctica | AN11 | 1 | 117 | 9.749780 | 0.038948 | Half Protected | #63CFAB | #9ED7C2 | #257339 | CC-BY 4.0 | POLYGON ((17090104.083 -10646152.188, 17100906... |
| 1 | 2.0 | Admiralty Islands lowland rain forests | 1.0 | Tropical & Subtropical Moist Broadleaf Forests | Australasia | AU01 | 2 | 135 | 4.800349 | 0.170599 | Nature Could Reach Half Protected | #70A800 | #38A700 | #7BC141 | CC-BY 4.0 | MULTIPOLYGON (((16461836.873 -254248.259, 1644... |
| 2 | 3.0 | Aegean and Western Turkey sclerophyllous and m... | 12.0 | Mediterranean Forests, Woodlands & Scrub | Palearctic | PA12 | 4 | 785 | 162.523044 | 13.844952 | Nature Imperiled | #FF7F7C | #FE0000 | #EE1E23 | CC-BY 4.0 | MULTIPOLYGON (((3391149.749 4336064.109, 33985... |
| 3 | 4.0 | Afghan Mountains semi-desert | 13.0 | Deserts & Xeric Shrublands | Palearctic | PA13 | 4 | 807 | 15.084037 | 1.355536 | Nature Imperiled | #FA774D | #CC6767 | #EE1E23 | CC-BY 4.0 | MULTIPOLYGON (((7369001.698 4093509.259, 73168... |
| 4 | 5.0 | Ahklun and Kilbuck Upland Tundra | 11.0 | Tundra | Nearctic | NE11 | 1 | 404 | 22.590087 | 8.196573 | Half Protected | #4C82B6 | #9ED7C2 | #257339 | CC-BY 4.0 | MULTIPOLYGON (((-17912546.29 8050475.591, -179... |
| ... | ... | ... | ... | ... | ... | ... | ... | ... | ... | ... | ... | ... | ... | ... | ... | ... |
| 842 | 848.0 | Sulawesi lowland rain forests | 1.0 | Tropical & Subtropical Moist Broadleaf Forests | Australasia | AU01 | 2 | 156 | 150.744361 | 9.422097 | Nature Could Reach Half Protected | #70A800 | #38A700 | #7BC141 | CC-BY 4.0 | MULTIPOLYGON (((14113374.546 501721.962, 14128... |
| 843 | 212.0 | East African montane forests | 1.0 | Tropical & Subtropical Moist Broadleaf Forests | Afrotropic | AF01 | 3 | 8 | 157.848926 | 5.010930 | Nature Could Recover | #13ED00 | #38A700 | #F9A91B | CC-BY 4.0 | MULTIPOLYGON (((4275410.576 -149750.128, 42781... |
| 844 | 224.0 | Eastern Arc forests | 1.0 | Tropical & Subtropical Moist Broadleaf Forests | Afrotropic | AF01 | 3 | 9 | 34.153333 | 0.890325 | Nature Could Recover | #267400 | #38A700 | #F9A91B | CC-BY 4.0 | MULTIPOLYGON (((4302962.15 -537675.265, 431112... |
| 845 | 79.0 | Borneo montane rain forests | 1.0 | Tropical & Subtropical Moist Broadleaf Forests | Indomalayan | IN01 | 2 | 220 | 38.280990 | 9.358407 | Nature Could Reach Half Protected | #23DB01 | #38A700 | #7BC141 | CC-BY 4.0 | MULTIPOLYGON (((13126956.393 539092.917, 13136... |
| 846 | 376.0 | Kinabalu montane alpine meadows | 10.0 | Montane Grasslands & Shrublands | Indomalayan | IN10 | 3 | 313 | 5.722539 | 0.352694 | Nature Could Recover | #C48832 | #D6C39D | #F9A91B | CC-BY 4.0 | POLYGON ((12969427.743 685487.72, 12977997.647... |
847 rows × 16 columns
## Make the Plot
# Join the occurrences with the plotting GeoDataFrame
occurrence_gdf = gdf_ecoregions.join(occurrence_df[['norm_occurrences']])
# Get the plot bounds so they don't change with the slider
xmin, ymin, xmax, ymax = occurrence_gdf.total_bounds
#set up of month widget slider
month_widget= (
pn.widgets.DiscreteSlider(
options={
calendar.month_abbr[month_num] :month_num
for month_num in range(1,12)
}
)
)
# Plot occurrence by ecoregion and month
migration_plot = (
occurrence_gdf
.hvplot(
#rasterize=True,
c='norm_occurrences',
groupby='month',
# Use background tiles
#geo=True, #crs=ccrs.Mercator(),
tiles='CartoLight',
title="Sandhill Crane Migration, By Month",
xlim=(xmin, xmax), ylim=(ymin, ymax),
frame_height=600,
frame_width=1400,
#change widget to show months
widgets= {'month': month_widget},
widget_location='bottom'
)
)
# Save the plot
migration_plot.save('migration_pp.html', embed=True)
# Show the plot
migration_plot
WARNING:W-1005 (FIXED_SIZING_MODE): 'fixed' sizing mode requires width and height to be set: figure(id='p162803', ...)
BokehModel(combine_events=True, render_bundle={'docs_json': {'ffce0ce6-6635-434b-a442-0d4dbb0aba32': {'version…